This project is described to the extent to which is possible as some of its details are confidential.
“Can’t see the forest for the trees”
The problem: The potential influence of this company goes well beyond the direct users of the product. It reaches several intermediaries, making it difficult for stakeholders to understand the market.
1. Counting the trees
Imagine a company in which part of the user journeys are defined not only by the way particular archetypes or personas progress through an experience but the way they interact with other agents. More than a map of a subway line, think about the entire subway system. To tackle this issue I designed an information system based on social network theory.
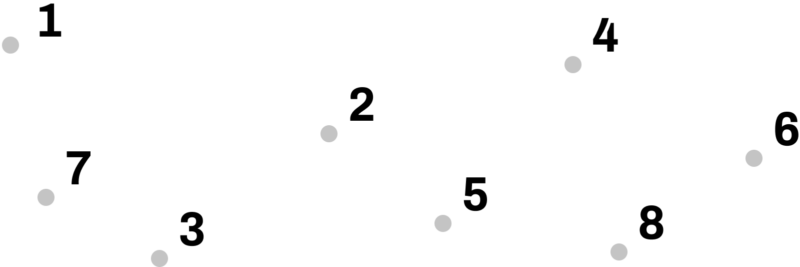
The first step consisted of identifying all the participants in the network whether individual agents or institutions. This step required interviews with our stakeholders about their regular interactions.
It is important to mention that because some interactions could be unintentionally omitted and new interactions could emerge either during the development of the project or after, the system had to allow for constant iteration and correction.
2. Making connections
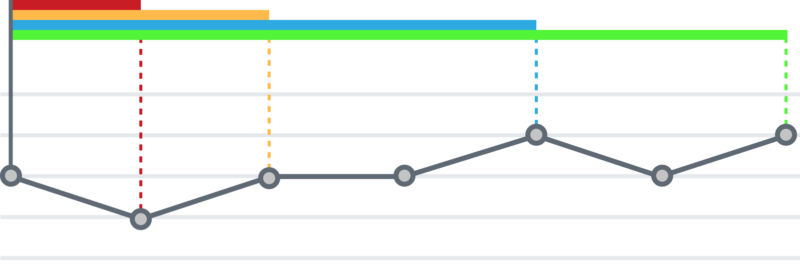
Once the participants in interactions with stakeholders had been identified, these agents were then displayed in an adjacency matrix, which allows for making potential points of interaction visible.
3. It’s all about relationships
Once the participants and potential points of interaction were identified, it was necessary to characterize the participants (either as archetypes, personas, etc) and thoroughly describe those interactions.
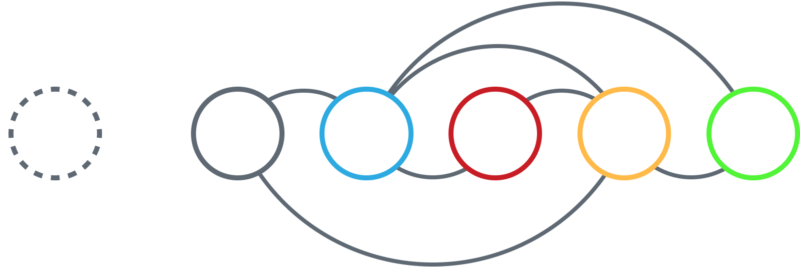
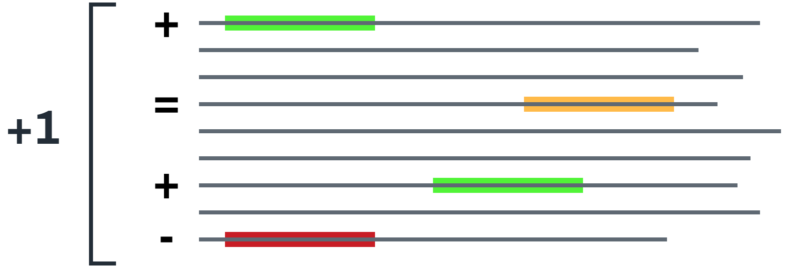
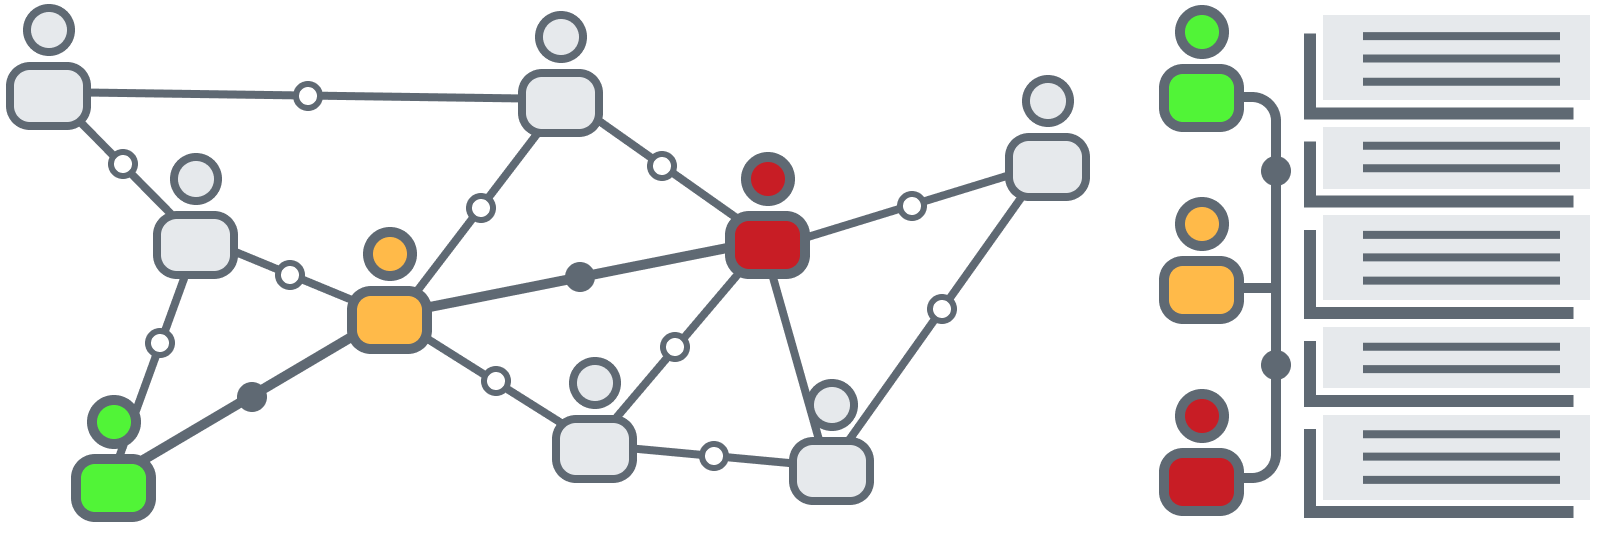
This matrix was then translated into a network graph. Traditionally, this kind of graphs consist of only 2 elements: nodes and edges. The nodes represent the elements to be connected and the edges, the connections. These connections can be described as directed, when they are unidirectional, and undirected when they run in both directions. In a traditional network graph, the nodes carry most of the information and the edges can only reflect quantitative values, which are used to run statistical analyses. For this design, because the network model was used merely as a form to organize knowledge sources, it was necessary to create an intermediary node, one that would detail the characteristics of the relationship.
4. A network of stories
This approach brought many advantages, among which are a unified landscape of the relationships within the company, which allowed for the identification of potential areas of opportunity and, at the same time, the possibility of zooming into specific relationships in a simple, narrative way.
These narrative were then taken by the pertinent units to elaborate strategic plans and other tools.