This project is described to the extent to which is possible as some of its details are confidential.
“Can we quantify qualitative data?”
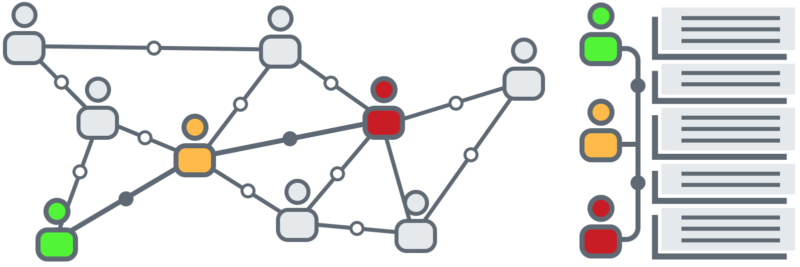
The problem: Getting true metrics from textual data is hard. You can always give users quantitative surveys, and if one is consistent with the distributions, you’ll have a reliable method of comparing performance, or at least, users’ perception of performance. But what if your text input is not natively quantitative? What would you do with emails, text messages and tweets? These are the cases in which sentiment analysis is useful.
1. Sentimental values
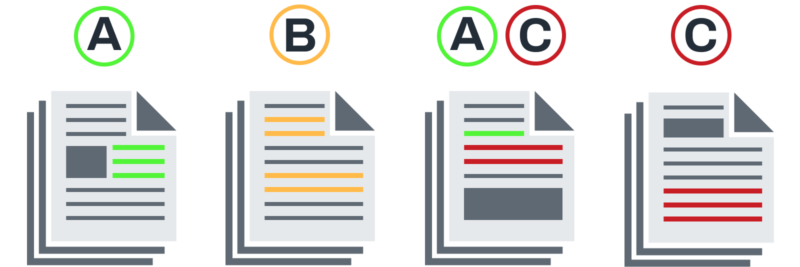
Sentiment analysis is an approach to evaluate people’s attitudes towards a specific topic based on the words used to address such a topic. Sentiment analysis tools score phrases or full paragraphs as positive, negative or neutral and some even give a numeric score. However, most of the commercially available tools are not clear about the methodology used to perform these analyses (and in some cases, they are quite expensive). Instead of using an existing tool, I decided to create one that would allow me and my team to get not only the metrics that we wanted but also to iterate and improve the tool itself because, although the existing tools are good enough, they are generic and not designed for the specific needs of each user. Certainly, they were not designed for the company that I developed this solution for.
2. So sentimental…
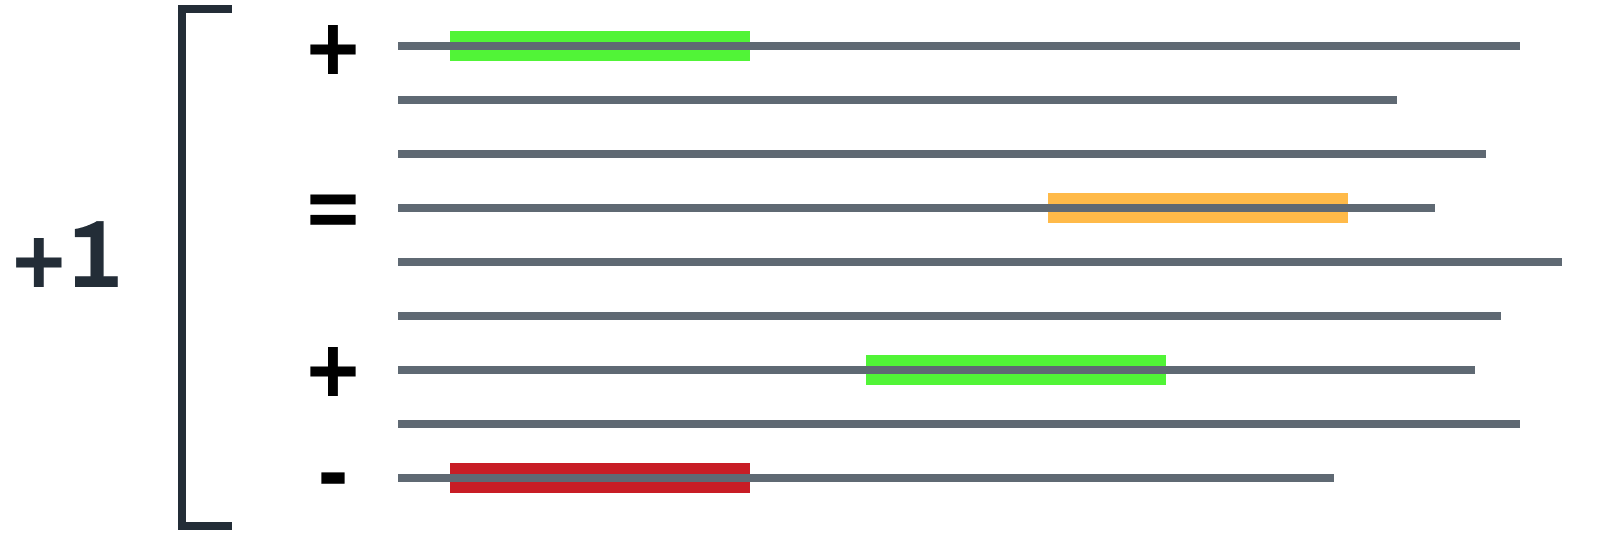
The proposed solution was (or at least sounds) quite simple: To use a database of words individually ranked for sentiment, identify them within a phrase, and average their sentiment values to get a general value for the entire phrase. The same approach could be taken for the entire corpus of phrases if necessary. As mentioned before, these phrases could come from tweets, emails or any other form of feedback in text format.
After identifying a suitable database, it was only a matter of developing a script that would compare the words in the analyzed phrases with the ranked database, retrieve their given value and average it.
3. One for all and all for one…
Besides providing the analysis itself, this approach allowed us to use the same bar to measure every potential text input, eliminating the problem of having to align different distributions. It also allowed us to identify the most commonly used words, and to rank and add our own words to the ranked list, adapting an existing resource to our own particular needs.